facebook pixel
Become a client
business-city

Case :

Virtual Business System Management Dashboard

Project from:

A company that develops business management software

Tasks to solve:

To create an innovative tool that helps managers and IT teams visualize the structure of their software system, monitor the real-time status of each module, and interact with data easily — all in an intuitive format.

Technologies used:

JavaScript
Three.js
OrbitControls
XRControllerModelFactory
WebXR
HTMLMesh
PostProcessing

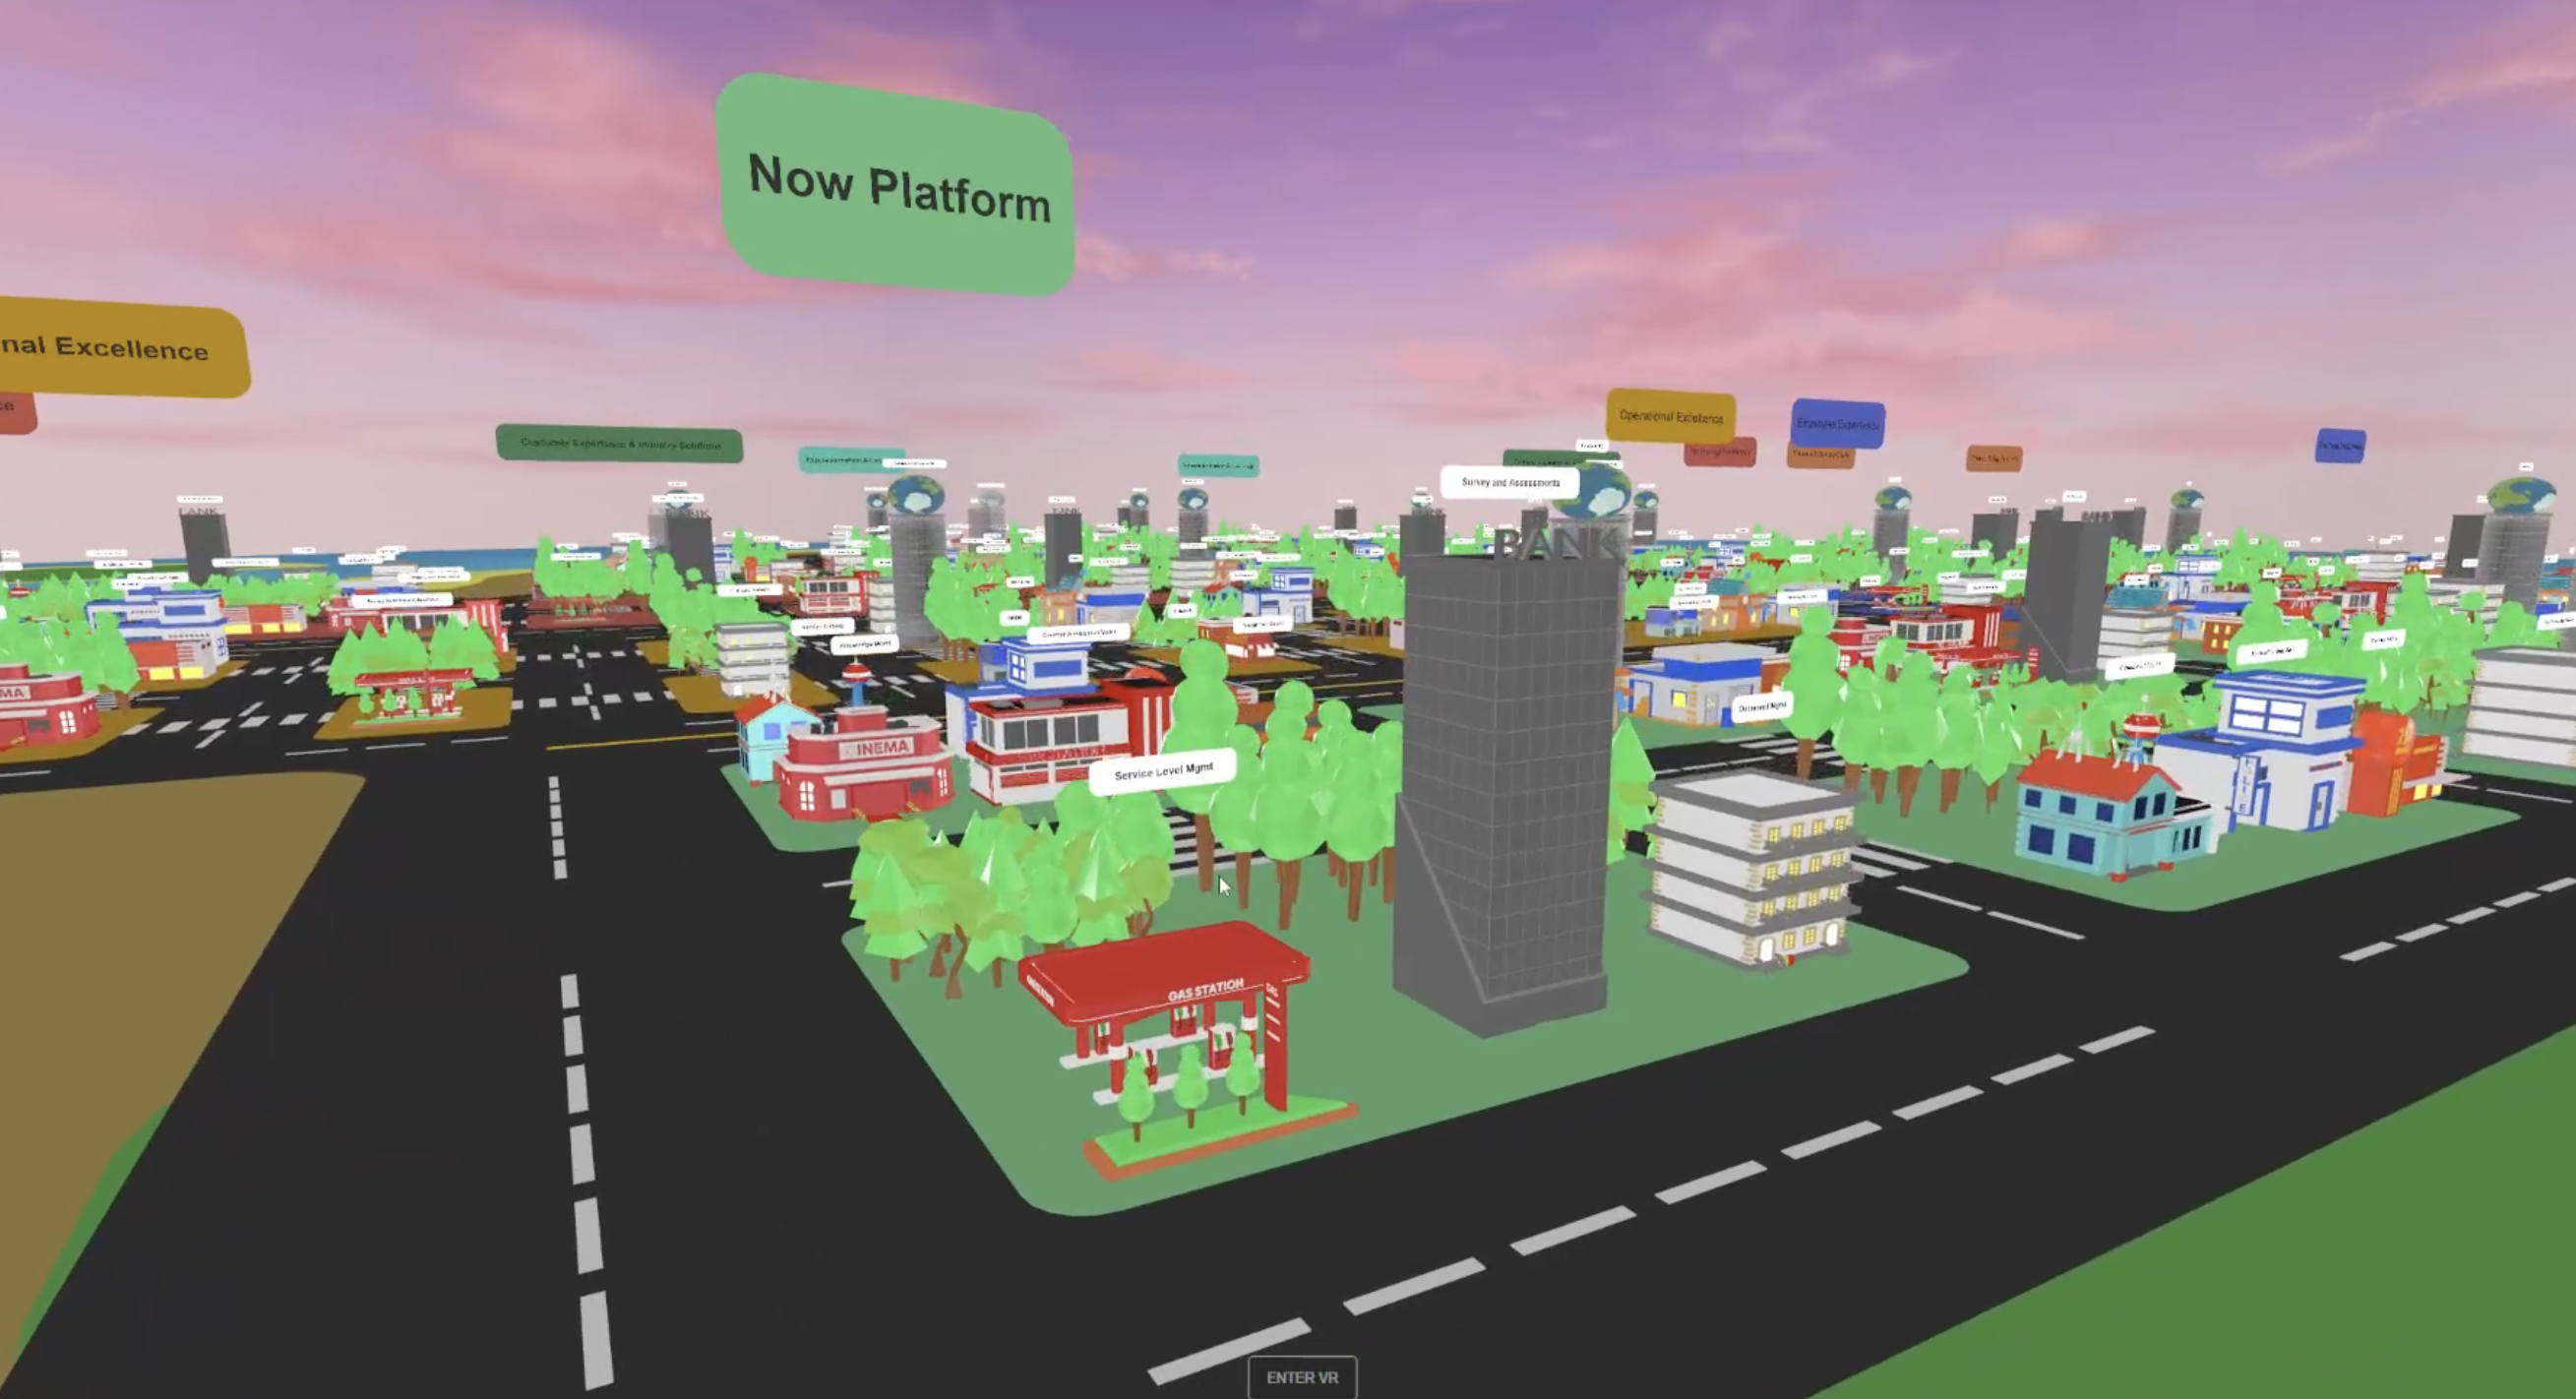
We developed a web application in the form of a 3D city, where each building represents a specific software module. Color, transparency, and shape reflect the module’s current state, type, or role. Interactive info panels are attached to each building, displaying real-time data pulled via API.

The application works in both a standard browser and VR mode, allowing users to explore the system from a bird’s eye view or immerse themselves in it — without any need for technical knowledge or installations.


Result:


This interactive city-like visualization simplifies business system monitoring, improves team communication, and makes the software architecture easier to understand and present — both internally and to clients.

ua-flag ua-flag

Сайт доступний українською мовою!
Для найкращого досвіду, рекомендуємо перейти на українську версію